| #1 |
Univ of Alaska
|
What is Aurora? How it happens? Many educational materials are here. Poker Flat Research Site has Aurora prediction data for Alaska area.  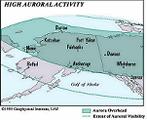
|
| #2 |
The Aurora Page
|
Information, links and images about the "Northern Lights".
|
| #3 |
Jan Cartis Images of Aurora
|
This site contains a lot of beautiful pictures.
|
| #4 |
Aurora over Kiruna
|
The author used to live at Kiruna, Sweden. This site has many Aurora pictures taken by the Author. In addition, the bulletin board in this site contains a lot of useful tips and information for Aurora related topics.(in Japanese)
|
| #5A |
STD Aurora Sighting (Text report) |
Bulletin board for Aurora sighting reports. This text-based bulletin board is updated every 2 minutes. |
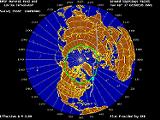
| #5B |
STD Aurora Monitor (Graphic Data)
|
Same site as above has polar map display of earth, depicting various asect of aurora activities. Visibility forecast is also available.
|
| #6 |
The Portable Auroral Imager (PAI)
|
Site for Aurora Research facility of Univ. of Calgary. Images taken at this facility can be seen here. Movies obtained with high sensitivity camera, resulting in high time-resolution images are also available.
|
| #7 |
John Hopkins University
|
Auroral Particles and Imagery Group at The Johns Hopkins University Applied Physics Laboratory (JHU/APL)
|
| #8 |
Sodankylä Geophysical Observatory
|
Aurora Observatory in Finland. This site contains Aurora pictures.
|
| #9 |
Non-official Page of Finland
|
Mr.Onoshima's Page. Aurora related subjects such as [Aurora Observation], [Aurora Photography] are discussed.(in Japanese)
|
| #10 |
Aurora in Finland
|
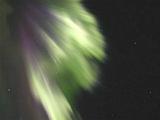 Mr. Ide's web. He is resident in Finland. This site has great pictures and links. New pictures of 2002 are uploaded. (in Japanese) Mr. Ide's web. He is resident in Finland. This site has great pictures and links. New pictures of 2002 are uploaded. (in Japanese)
(The image from this site used with the owner's permission.)
|
| #11 |
Takashi Murata's Webpage
|
He is currently resident in Sweden.(in English and Japanese)
|
| #12 |
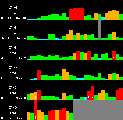
Hiraiso Solar Terrestrial Research Center
|
|
Obsevation data including Geomagnetic activities are reported here. Among them, Geomagnetic activity chart shows trace of Kp value over the past. One holizontal line represents 27 days, therefore, total of 6X27 days' record is shown in one graph. Also there is a link-list for Solar activities.
|
|
| #13 |
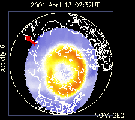
NOAA
|
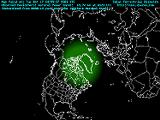
|
This web site contains data obtained from NOAA satellite. Among them, there is a polar image showing Aurora visibility forecast. The ring color changes according to Kp value. Red means high geomagnetic activity. Also, this site has learning materials.
|
|
| #14 |
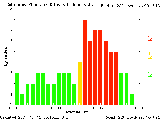
K-Index
|
|
This page is part of NOAA site and contains chart showing Kp value for the past three days. Kp value is color coded; green is "quiet" whereas red is "active". This chart is updated every 3 minutes.
|
|